Twice as Many Burglaries in Municipality of Oudewater and Eemnes in 2018
Based on the figures from Crime in Map, published by Politie.nl, Quick Locksmith Amsterdam 365 commissioned a survey of all burglaries in 2018 in the province of Utrecht.
In this article, we show you the burglary rates of 2018 and the burglary rates compared to 2017. We show in which municipality in Utrecht the probability of burglaries is higher compared to other municipalities and in which municipality the burglary rate has decreased the most.
What stands out in the research in municipality of Utrecht:
- Six times more burglaries (proportionally) in municipality of Baarn than municipality of Wijk bij Duurstede.
- Smallest municipality (Renswoud) has proportionally twice as many burglaries as the second smallest municipality (Lopik).
- Two largest municipalities (Utrecht and Amersfoort) have about the same number of burglaries (proportionally).
- Municipality of Bunschoten has an approximately 45% decrease in burglaries.
Number of Burglaries Per Municipality Per 10,000 Inhabitants in Utrecht in 2018
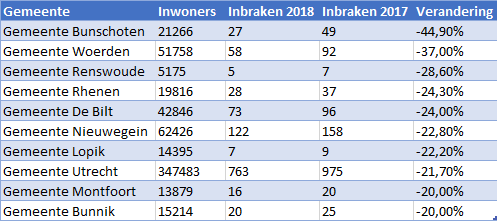
10 Municipalities With the Biggest Decline in Burglaries in Utrecht (2018 vs. 2017)
The positive first: the municipalities in the province of Utrecht where less was broken.
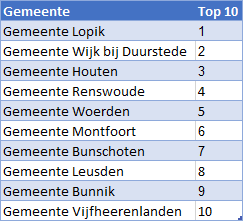
10 Municipalities With the Least Burglaries in Utrecht in 2018
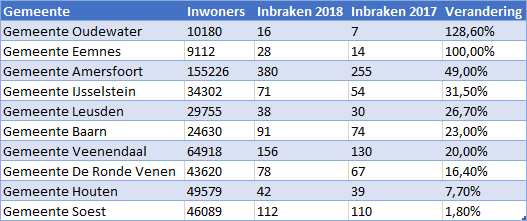
10 Municipalities With the Greatest Increase in Burglaries in Utrecht (2018 vs. 2017)
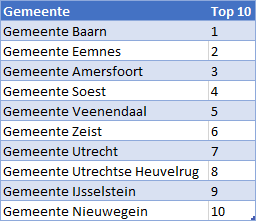
10 Municipalities With the Most Burglaries in Utrecht in 2018
Comparison Number of Burglaries 2018 vs. 2017 By Municipality in Utrecht
All Burglary Investigations 2018
Burglary Research in the Netherlands (2018)
Burglary Investigation Province of Groningen (2018)
Burglary Investigation Province of Friesland (2018)
Burglary Investigation Province of North Holland (2018)
Burglary Investigation County of Drenthe (2018)
Burglary Investigation Province of Flevoland (2018)
Burglary Investigation Province of Overijssel (2018)
Burglary Investigation Province of Gelderland (2018)
Burglary Investigation Province of South Holland (2018)
Burglary Investigation Province of Utrecht (2018)
Burglary Investigation Province of Zeeland (2018)
Burglary Investigation Province of North Brabant (2018)
Burglary Investigation Province of Limburg (2018)
Total Overview Number of Burglaries in Province of Utrecht By Municipality (2018 & 2017)
| Place name | Number of inhabitants | Burglaries 2018 | Per 10,000 population 2018 | Burglaries 2017 | Per 10,000 population 2017 | Change |
| Municipality of Lopik | 14395 | 7 | 5 | 9 | 6 | -22,20% |
| Municipality of Wijk bij Duurstede | 23678 | 15 | 6 | 18 | 8 | -16,70% |
| Municipality of Houten | 49579 | 42 | 8 | 39 | 8 | 7,70% |
| Municipality of Renswoude | 5175 | 5 | 10 | 7 | 14 | -28,60% |
| Municipality of Woerden | 51758 | 58 | 11 | 92 | 18 | -37,00% |
| Municipality of Montfoort | 13879 | 16 | 12 | 20 | 14 | -20,00% |
| Municipality of Bunnik | 15214 | 20 | 13 | 25 | 16 | -20,00% |
| Municipality of Bunschoten | 21266 | 27 | 13 | 49 | 23 | -44,90% |
| Municipality of Leusden | 29755 | 38 | 13 | 30 | 10 | 26,70% |
| Municipality of Rhenen | 19816 | 28 | 14 | 37 | 19 | -24,30% |
| Municipality of Vijfheerenlanden | 55001 | 75 | 14 | 78 | 14 | -3,80% |
| Municipality of Stichtse Vecht | 64513 | 98 | 15 | 111 | 17 | -11,70% |
| Municipality of Oudewater | 10180 | 16 | 16 | 7 | 7 | 128,60% |
| Municipality of De Bilt | 42846 | 73 | 17 | 96 | 22 | -24,00% |
| Municipality of Woudenberg | 13021 | 22 | 17 | 26 | 20 | -15,40% |
| Municipality of De Ronde Venen | 43620 | 78 | 18 | 67 | 15 | 16,40% |
| Municipality of Nieuwegein | 62426 | 122 | 20 | 158 | 25 | -22,80% |
| Municipality of IJsselstein | 34302 | 71 | 21 | 54 | 16 | 31,50% |
| Municipality of Utrechtse Heuvelrug | 49314 | 104 | 21 | 122 | 25 | -14,80% |
| Municipality of Utrecht | 347483 | 763 | 22 | 975 | 28 | -21,70% |
| Municipality of Zeist | 63322 | 146 | 23 | 168 | 27 | -13,10% |
| Municipality of Amersfoort | 155226 | 380 | 24 | 255 | 16 | 49,00% |
| Municipality of Soest | 46089 | 112 | 24 | 110 | 24 | 1,80% |
| Municipality of Veenendaal | 64918 | 156 | 24 | 130 | 20 | 20,00% |
| Municipality of Eemnes | 9112 | 28 | 31 | 14 | 15 | 100,00% |
| Municipality of Baarn | 24630 | 91 | 37 | 74 | 30 | 23,00% |

