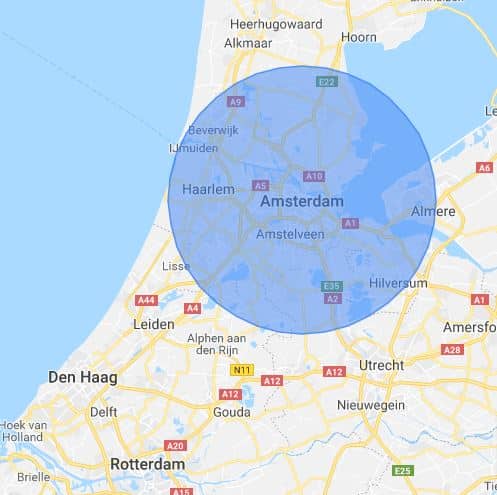
27% Fewer Burglaries in Amsterdam in 2018
Based on figures from Crime in Map, published by Politie.nl, Locksmith Amsterdam 365 commissioned a survey of all burglaries in 2018 in the province of North Holland. In this article, we show you the burglary rates of 2018 and the burglary rates compared to 2017. We show which municipality in North Holland is more likely to experience burglaries compared to other municipalities, and which municipality has seen the greatest decrease in burglary rates. What stands out in the survey in North Holland municipality:- In the five largest cities, there has been at least an 18% drop in burglaries.
- The top 10 municipalities with largest increases in burglaries all have populations less than 30,000.
- The municipality of Texel has proportionally the least number of burglaries.
- Municipality of Beemster has the highest number of burglaries per 10,000 residents: 36.7. At the same time, it is also one of the smallest municipality.
- Municipality of Heemskerk has decrease of more than 75% in number of burglaries.
Number of Burglaries Per Municipality Per 10,000 Inhabitants in North Holland in 2018
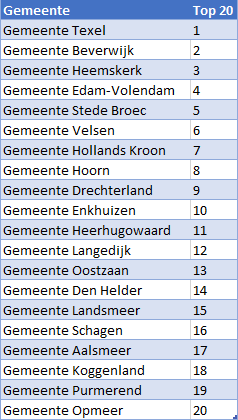
20 Municipalities With the Least Burglaries in North Holland in 2018
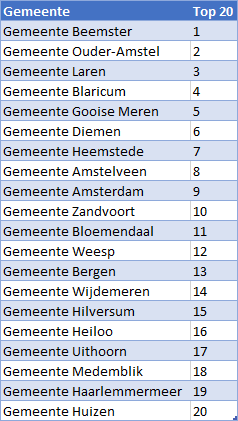
20 Municipalities With the Most Burglaries in North Holland in 2018
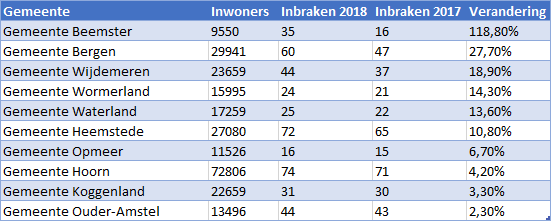
10 Municipalities With the Biggest Increase in Burglaries in North Holland (2018 vs. 2017)
20 Municipalities With the Biggest Decline in Burglaries in North Holland (2018 vs. 2017)
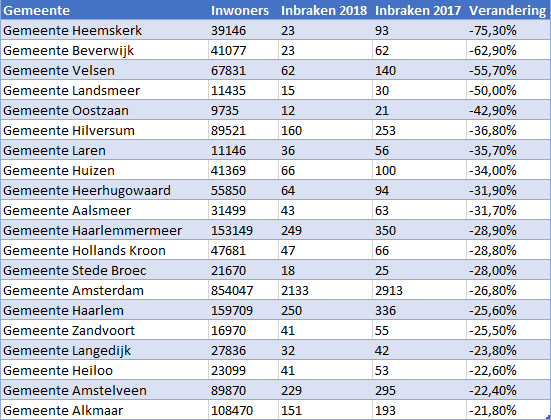
Comparison Number of Burglaries 2018 vs. 2017 By Municipality in North Holland
All Burglary Investigations 2018
Burglary Research in the Netherlands (2018) Burglary Investigation Province of Groningen (2018) Burglary Investigation Province of Friesland (2018) Burglary Investigation Province of North Holland (2018) Burglary Investigation County of Drenthe (2018) Burglary Investigation Province of Flevoland (2018) Burglary Investigation Province of Overijssel (2018) Burglary Investigation Province of Gelderland (2018) Burglary Investigation Province of South Holland (2018) Burglary Investigation Province of Utrecht (2018) Burglary Investigation Province of Zeeland (2018) Burglary Investigation Province of North Brabant (2018) Burglary Investigation Province of Limburg (2018)Total Overview Number of Burglaries in North Holland Province By Municipality (2018 & 2017)
| Place name | Number of inhabitants | Burglaries 2018 | Per 10000 inhabitants 2018 | Burglaries 2017 | Per 10000 population 2017 | Change |
| Municipality of Texel | 13584 | 6 | 4 | 7 | 5 | -14,30% |
| Municipality of Beverwijk | 41077 | 23 | 6 | 62 | 15 | -62,90% |
| Municipality of Heemskerk | 39146 | 23 | 6 | 93 | 24 | -75,30% |
| Municipality of Edam-Volendam | 35953 | 28 | 8 | 34 | 9 | -17,60% |
| Municipality of Stede Broec | 21670 | 18 | 8 | 25 | 12 | -28,00% |
| Municipality of Velsen | 67831 | 62 | 9 | 140 | 21 | -55,70% |
| Municipality of Drechterland | 19440 | 20 | 10 | 25 | 13 | -20,00% |
| Municipality of Hollands Kroon | 47681 | 47 | 10 | 66 | 14 | -28,80% |
| Municipality of Hoorn | 72806 | 74 | 10 | 71 | 10 | 4,20% |
| Municipality of Enkhuizen | 18476 | 21 | 11 | 22 | 12 | -4,50% |
| Municipality of Heerhugowaard | 55850 | 64 | 11 | 94 | 17 | -31,90% |
| Municipality of Langedijk | 27836 | 32 | 11 | 42 | 15 | -23,80% |
| Municipality of Oostzaan | 9735 | 12 | 12 | 21 | 22 | -42,90% |
| Municipality of Den Helder | 55760 | 70 | 13 | 83 | 15 | -15,70% |
| Municipality of Landsmeer | 11435 | 15 | 13 | 30 | 26 | -50,00% |
| Municipality of Schagen | 46379 | 62 | 13 | 74 | 16 | -16,20% |
| Municipality of Aalsmeer | 31499 | 43 | 14 | 63 | 20 | -31,70% |
| Municipality of Alkmaar | 108470 | 151 | 14 | 193 | 18 | -21,80% |
| Municipality of Koggenland | 22659 | 31 | 14 | 30 | 13 | 3,30% |
| Municipality of Opmeer | 11526 | 16 | 14 | 15 | 13 | 6,70% |
| Municipality of Purmerend | 79983 | 110 | 14 | 127 | 16 | -13,40% |
| Municipality of Waterland | 17259 | 25 | 14 | 22 | 13 | 13,60% |
| Municipality of Zaanstad | 154865 | 218 | 14 | 266 | 17 | -18,00% |
| Municipality of Castricum | 35608 | 55 | 15 | 56 | 16 | -1,80% |
| Municipality of Wormerland | 15995 | 24 | 15 | 21 | 13 | 14,30% |
| City of Haarlem | 159709 | 250 | 16 | 336 | 21 | -25,60% |
| Municipality of Haarlemmermeer | 153149 | 249 | 16 | 350 | 23 | -28,90% |
| Municipality of Huizen | 41369 | 66 | 16 | 100 | 24 | -34,00% |
| Municipality of Medemblik | 44480 | 73 | 16 | 74 | 17 | -1,40% |
| Municipality of Uitgeest | 13520 | 21 | 16 | 21 | 16 | 0,00% |
| Municipality of Heiloo | 23099 | 41 | 18 | 53 | 23 | -22,60% |
| Municipality of Hilversum | 89521 | 160 | 18 | 253 | 28 | -36,80% |
| Municipality of Uithoorn | 29445 | 52 | 18 | 61 | 21 | -14,80% |
| Municipality of Wijdemeren | 23659 | 44 | 19 | 37 | 16 | 18,90% |
| Municipality of Bergen | 29941 | 60 | 20 | 47 | 16 | 27,70% |
| Municipality of Weesp | 19147 | 41 | 21 | 51 | 27 | -19,60% |
| Municipality of Bloemendaal | 23208 | 55 | 24 | 67 | 29 | -17,90% |
| Municipality of Zandvoort | 16970 | 41 | 24 | 55 | 32 | -25,50% |
| Municipality of Amstelveen | 89870 | 229 | 25 | 295 | 33 | -22,40% |
| Municipality of Amsterdam | 854047 | 2133 | 25 | 2913 | 34 | -26,80% |
| Municipality of Heemstede | 27080 | 72 | 27 | 65 | 24 | 10,80% |
| Municipality of Diemen | 28121 | 80 | 28 | 86 | 31 | -7,00% |
| Municipality of Gooise Meren | 57337 | 171 | 30 | 202 | 35 | -15,30% |
| Municipality of Blaricum | 10795 | 33 | 31 | 40 | 37 | -17,50% |
| Municipality of Laren | 11146 | 36 | 32 | 56 | 50 | -35,70% |
| Municipality of Ouder-Amstel | 13496 | 44 | 33 | 43 | 32 | 2,30% |
| Municipality of Beemster | 9550 | 35 | 37 | 16 | 17 | 118,80% |

