13% Fewer Burglaries in South Holland 2018
Based on figures from Crime in Map, published by Politie.nl, Locksmith Amsterdam 365 commissioned a survey of all burglaries in 2018 in the province of South Holland. In this article, we show you the burglary rates of 2018 and the burglary rates compared to 2017. We show which municipality in South Holland is more likely to experience burglaries compared to other municipalities and which municipality has seen the sharpest decline in burglary rates. What stands out in the survey in municipality of South Holland:- Municipality Zoeterwoude, as the smallest municipality, has the largest decrease in burglaries of 70% and comparatively the fewest burglaries.
- There are more than twice as many burglaries in Delft and Rotterdam as in Alphen aan den Rijn, Zoetermeer and Leiden.
- In Delft municipality, the number of burglaries increased by almost 25%.
- In Brielle municipality, the number of burglaries increased by more than 40%.
- The population of a municipality says nothing about the number of burglaries per 10,000 residents.
Number of Burglaries Per Municipality Per 10,000 Inhabitants in South Holland in 2018
20 Municipalities With the Most Burglaries in South Holland in 2018
Most of the burglaries occurred in Westvoorne. From Oostvoorne to Rockanje, from Stuifakker to Tinte … unfortunately, most burglaries are reported here. With 14508 residents, this municipality has 32.40 burglaries per 10,000 residents. The dubious second place is for Municipality of Midden-Delfland with an average of 27.41 burglaries per 10,000 inhabitants while 19338 people live there. This is followed by Delft, Gouda and Wassenaar.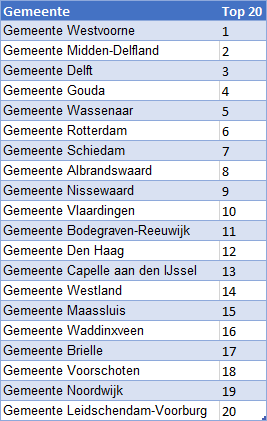
20 Municipalities With the Least Burglaries in South Holland in 2018
The fewest burglaries occurred in Zoeterwoude. The small municipality below Leiden proudly tops the list: 8430 residents and an average of 3.56 burglaries per 10,000 residents. A close second is municipality of Molenlanden with an average burglary rate of 4.11 out of 43846 residents. Krimpen aan de IJssel holds third place in this ranking. This is followed by Rijswijk and Lansingerland.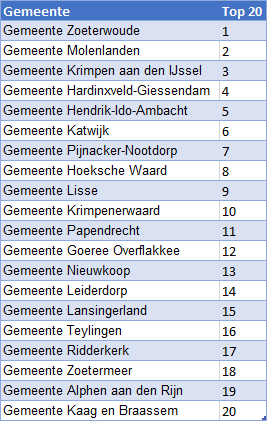
10 Municipalities With the Biggest Increase in Burglaries in South Holland (2018 vs. 2017)
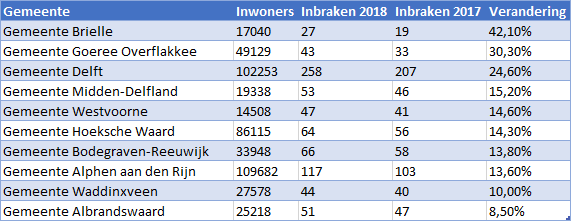
20 Municipalities With the Biggest Decline in Burglaries in South Holland (2018 vs. 2017)
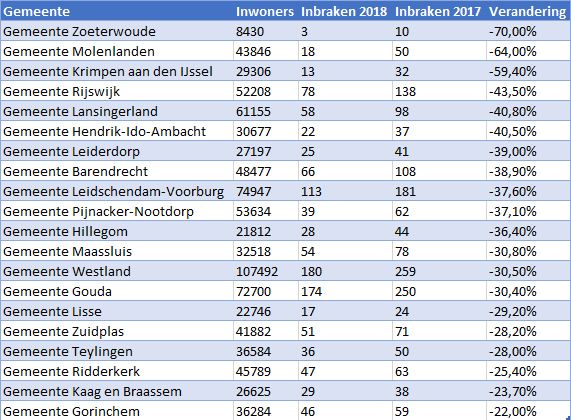
Comparison Number of Burglaries 2018 vs. 2017 By Municipality in South Holland
All Burglary Investigations 2018
Burglary Research in the Netherlands (2018) Burglary Investigation Province of Groningen (2018) Burglary Investigation Province of Friesland (2018) Burglary Investigation Province of North Holland (2018) Burglary Investigation County of Drenthe (2018) Burglary Investigation Province of Flevoland (2018) Burglary Investigation Province of Overijssel (2018) Burglary Investigation Province of Gelderland (2018) Burglary Investigation Province of South Holland (2018) Burglary Investigation Province of Utrecht (2018) Burglary Investigation Province of Zeeland (2018) Burglary Investigation Province of North Brabant (2018) Burglary Investigation Province of Limburg (2018)Total Overview Number of Burglaries in Province of South Holland By Municipality (2018 & 2017)
| Place name | Number of inhabitants | Burglaries 2018 | Per 10000 inhabitants 2018 | Burglaries 2017 | Per 10000 population 2017 | Change |
| Municipality of Zoeterwoude | 8430 | 3 | 4 | 10 | 12 | -70,00% |
| Municipality of Molenlanden | 43846 | 18 | 4 | 50 | 11 | -64,00% |
| Municipality of Krimpen aan den IJssel | 29306 | 13 | 4 | 32 | 11 | -59,40% |
| Municipality of Hardinxveld-Giessendam | 17958 | 12 | 7 | 15 | 8 | -20,00% |
| Municipality of Hendrik-Ido-Ambacht | 30677 | 22 | 7 | 37 | 12 | -40,50% |
| Municipality of Katwijk | 64956 | 47 | 7 | 56 | 9 | -16,10% |
| Municipality of Pijnacker-Nootdorp | 53634 | 39 | 7 | 62 | 12 | -37,10% |
| Municipality of Hoeksche Waard | 86115 | 64 | 7 | 56 | 7 | 14,30% |
| Municipality of Lisse | 22746 | 17 | 7 | 24 | 11 | -29,20% |
| Municipality of Krimpenerwaard | 55644 | 46 | 8 | 52 | 9 | -11,50% |
| Municipality of Papendrecht | 32264 | 28 | 9 | 34 | 11 | -17,60% |
| Municipality of Goeree Overflakkee | 49129 | 43 | 9 | 33 | 7 | 30,30% |
| Municipality of Nieuwkoop | 28269 | 25 | 9 | 28 | 10 | -10,70% |
| Municipality of Leiderdorp | 27197 | 25 | 9 | 41 | 15 | -39,00% |
| Municipality of Lansingerland | 61155 | 58 | 9 | 98 | 16 | -40,80% |
| Municipality of Teylingen | 36584 | 36 | 10 | 50 | 14 | -28,00% |
| Municipality of Ridderkerk | 45789 | 47 | 10 | 63 | 14 | -25,40% |
| Municipality of Zoetermeer | 124695 | 128 | 10 | 137 | 11 | -6,60% |
| Municipality of Alphen aan den Rijn | 109682 | 117 | 11 | 103 | 9 | 13,60% |
| Municipality of Kaag and Braassem | 26625 | 29 | 11 | 38 | 14 | -23,70% |
| Municipality of Leiden | 124306 | 141 | 11 | 162 | 13 | -13,00% |
| Municipality of Alblasserdam | 20014 | 23 | 11 | 26 | 13 | -11,50% |
| Municipality of Sliedrecht | 25020 | 29 | 12 | 29 | 12 | 0,00% |
| Municipality of Zuidplas | 41882 | 51 | 12 | 71 | 17 | -28,20% |
| Municipality of Zwijndrecht | 44586 | 56 | 13 | 65 | 15 | -13,80% |
| Municipality of Gorinchem | 36284 | 46 | 13 | 59 | 16 | -22,00% |
| Municipality of Hillegom | 21812 | 28 | 13 | 44 | 20 | -36,40% |
| Municipality of Hellevoetsluis | 39992 | 52 | 13 | 62 | 16 | -16,10% |
| Municipality of Barendrecht | 48477 | 66 | 14 | 108 | 22 | -38,90% |
| Municipality of Dordrecht | 118426 | 168 | 14 | 176 | 15 | -4,50% |
| Municipality of Rijswijk | 52208 | 78 | 15 | 138 | 26 | -43,50% |
| Municipality of Oegstgeest | 23887 | 36 | 15 | 38 | 16 | -5,30% |
| Municipality of Leidschendam-Voorburg | 74947 | 113 | 15 | 181 | 24 | -37,60% |
| Municipality of Noordwijk | 42661 | 65 | 15 | 82 | 19 | -20,70% |
| Municipality of Voorschoten | 25453 | 39 | 15 | 46 | 18 | -15,20% |
| Municipality of Brielle | 17040 | 27 | 16 | 19 | 11 | 42,10% |
| Municipality of Waddinxveen | 27578 | 44 | 16 | 40 | 15 | 10,00% |
| Municipality of Maassluis | 32518 | 54 | 17 | 78 | 24 | -30,80% |
| Municipality of Westland | 107492 | 180 | 17 | 259 | 24 | -30,50% |
| Municipality of Capelle aan den IJssel | 66854 | 116 | 17 | 142 | 21 | -18,30% |
| Municipality of The Hague | 532561 | 1014 | 19 | 1072 | 20 | -5,40% |
| Municipality of Bodegraven-Reeuwijk | 33948 | 66 | 19 | 58 | 17 | 13,80% |
| Municipality of Vlaardingen | 72050 | 141 | 20 | 158 | 22 | -10,80% |
| Municipality of Nissewaard | 84593 | 171 | 20 | 196 | 23 | -12,80% |
| Municipality of Albrandswaard | 25218 | 51 | 20 | 47 | 19 | 8,50% |
| Municipality of Schiedam | 77907 | 158 | 20 | 173 | 22 | -8,70% |
| Municipality of Rotterdam | 638712 | 1385 | 22 | 1520 | 24 | -8,90% |
| Municipality of Wassenaar | 26084 | 59 | 23 | 61 | 23 | -3,30% |
| Municipality of Gouda | 72700 | 174 | 24 | 250 | 34 | -30,40% |
| Municipality of Delft | 102253 | 258 | 25 | 207 | 20 | 24,60% |
| Municipality of Midden-Delfland | 19338 | 53 | 27 | 46 | 24 | 15,20% |
| Municipality of Westvoorne | 14508 | 47 | 32 | 41 | 28 | 14,60% |

