Number of Burglaries Sharply Decreased in Gelderland in 2018
Based on the figures from Crime in Map, published by Politie.nl, Locksmith Amsterdam 365 commissioned a survey of all burglaries in 2018 in the province of Gelderland. In this article, we show you the burglary rates of 2018 and the burglary rates compared to 2017. We show which municipality in Gelderland is more likely to experience burglaries compared to other municipalities and which municipality has seen the greatest decrease in burglary rates. In the Netherlands, the number of burglaries decreased by 11.6 percent in 2018. In Gelderland, the number of burglaries fell by a whopping 21.7 percent. In the Netherlands, there is an average of 17.1 burglaries per 10,000 residents. In Gelderland, there are 13.7 burglaries per 10,000 residents. This puts Gelderland well below average. What else stands out in municipality of Gelderland:- In only 8 municipalities did the number of burglaries increase significantly.
- In Rozendaal municipality, proportionally, the most burglaries occurred and increased the most by 66.67%.
- The 3 municipality with the largest increase in burglaries (Rozendaal, Oldebroek and Maasdriel) increased the number of burglaries proportionally more than twice as much as any other municipality.
- The municipality of Apeldoorn has at least 20% fewer burglaries than other large municipalities in Gelderland.
- In the municipality of Oude IJsselstreek, the number of burglaries fell by almost 70%.
Number of Burglaries Per Municipality Per 10,000 Inhabitants in Gelderland in 2018
20 Municipalities With the Most Burglaries in Gelderland in 2018
In the municipality of Rozendaal, burglaries were most likely to occur in 2018. There were 31.8 burglaries per 10,000 residents. This is well above the national average. Next comes Ede: 22.9 burglaries per 10,000 inhabitants. Wageningen ranks number 3 with 19.3 burglaries per 10,000 residents. At number 4 is Arnhem: 19.1 inhabitants per 10,000. Nijmegen is at number 5. There were 17.9 burglaries per 10,000 residents in 2018.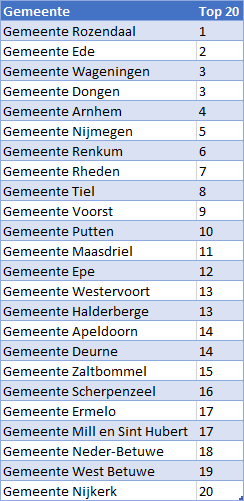
20 Municipalities With the Least Burglaries in Gelderland in 2018
Winterswijk has the fewest burglaries, only 4.5 burglaries per 10,000 residents. At number 2 is the Oude IJsselstreek with 5.1 burglaries per 10,000 inhabitants. Hattem comes in at No. 3: 6.6 burglaries per 10,000 residents. At No. 4 is Elberg with 6.9 burglaries 10,000. Number 5 is Harderwijk: 7.3 burglaries per 10,000 inhabitants.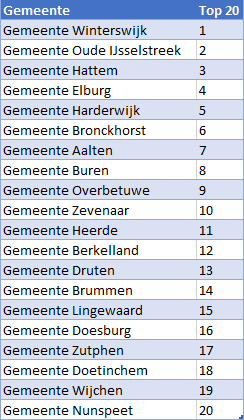
Comparison Number of Burglaries 2018 vs. 2017 By Municipality in Gelderland
10 Municipalities With the Greatest Increase in Burglaries in Gelderland (2018 vs. 2017)
Not everywhere in Gelderland has the number of burglaries dropped. A number of municipalities saw more burglaries in 2018 than in 2017. In Rozendaal, the largest increase is 66.7 percent. Next comes Oldebroek with 38.1 percent. The municipality of Maasdriel is No. 3 with a 37.9 percent increase. Fourth is Lower Betuwe: down 17.9 percent. Finally, No. 5 is Nijkerk with 14.0 percent.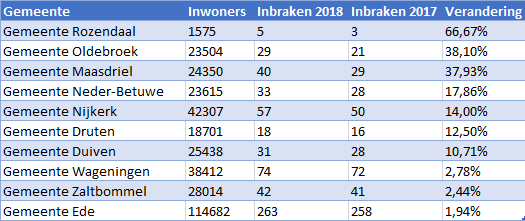
10 Municipalities With the Biggest Decline in Burglaries in Gelderland (2018 vs. 2017)
The number of burglaries decreased in most municipalities in Gelderland. The largest decrease is in the Oude IJsselstreek, where there were 69.7 percent fewer burglaries in 2018 than in the previous year. Winterswijk also saw a large drop in burglaries, 61.8 percent. Doesburg is No. 3: 59.3 percent. At 4 is Zutphen: 59.0 percent. Finally, at 5 is Brummer with a 58.3 percent drop.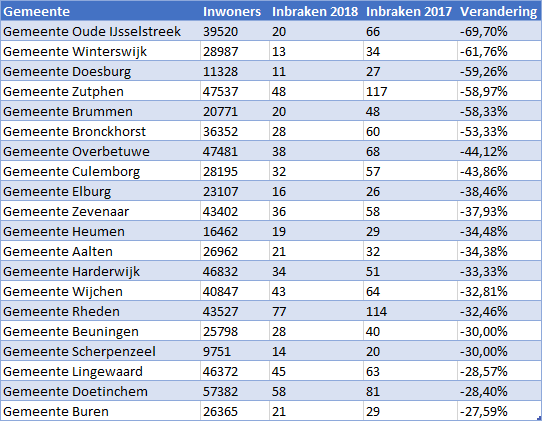
All Burglary Investigations 2018
Burglary Research in the Netherlands (2018) Burglary Investigation Province of Groningen (2018) Burglary Investigation Province of Friesland (2018) Burglary Investigation Province of North Holland (2018) Burglary Investigation County of Drenthe (2018) Burglary Investigation Province of Flevoland (2018) Burglary Investigation Province of Overijssel (2018) Burglary Investigation Province of Gelderland (2018) Burglary Investigation Province of South Holland (2018) Burglary Investigation Province of Utrecht (2018) Burglary Investigation Province of Zeeland (2018) Burglary Investigation Province of North Brabant (2018) Burglary Investigation Province of Limburg (2018)Total Overview Number of Burglaries in Province of Gelderland By Municipality (2018 & 2017)
| Place name | Number of inhabitants | Burglaries 2018 | Per 10,000 population 2018 | Burglaries 2017 | Per 10,000 population 2017 | Change |
| Municipality of Winterswijk | 28987 | 13 | 4 | 34 | 12 | -61,76% |
| Municipality of Oude IJsselstreek | 39520 | 20 | 5 | 66 | 17 | -69,70% |
| Municipality of Elburg | 23107 | 16 | 7 | 26 | 11 | -38,46% |
| Municipality of Harderwijk | 46832 | 34 | 7 | 51 | 11 | -33,33% |
| Municipality of Hattem | 12154 | 8 | 7 | 10 | 8 | -20,00% |
| Municipality of Aalten | 26962 | 21 | 8 | 32 | 12 | -34,38% |
| Municipality of Bronckhorst | 36352 | 28 | 8 | 60 | 17 | -53,33% |
| Municipality of Buren | 26365 | 21 | 8 | 29 | 11 | -27,59% |
| Municipality of Overbetuwe | 47481 | 38 | 8 | 68 | 14 | -44,12% |
| Municipality of Zevenaar | 43402 | 36 | 8 | 58 | 13 | -37,93% |
| Municipality of Berkelland | 44032 | 38 | 9 | 48 | 11 | -20,83% |
| Municipality of Heerde | 18603 | 16 | 9 | 21 | 11 | -23,81% |
| Municipality of Brummen | 20771 | 20 | 10 | 48 | 23 | -58,33% |
| Municipality of Doesburg | 11328 | 11 | 10 | 27 | 24 | -59,26% |
| Municipality of Doetinchem | 57382 | 58 | 10 | 81 | 14 | -28,40% |
| Municipality of Druten | 18701 | 18 | 10 | 16 | 9 | 12,50% |
| Municipality of Lingewaard | 46372 | 45 | 10 | 63 | 14 | -28,57% |
| Municipality of Zutphen | 47537 | 48 | 10 | 117 | 25 | -58,97% |
| Municipality of Beuningen | 25798 | 28 | 11 | 40 | 16 | -30,00% |
| Municipality of Culemborg | 28195 | 32 | 11 | 57 | 20 | -43,86% |
| Municipality of Nunspeet | 27114 | 29 | 11 | 39 | 14 | -25,64% |
| Municipality of Wijchen | 40847 | 43 | 11 | 64 | 16 | -32,81% |
| Municipality of Berg and Dal | 34748 | 42 | 12 | 49 | 14 | -14,29% |
| Municipality of Duiven | 25438 | 31 | 12 | 28 | 11 | 10,71% |
| Municipality of Heumen | 16462 | 19 | 12 | 29 | 18 | -34,48% |
| Municipality of Oldebroek | 23504 | 29 | 12 | 21 | 9 | 38,10% |
| Municipality of Oost Gelre | 29672 | 35 | 12 | 46 | 16 | -23,91% |
| Municipality of West Maas and Waal | 18891 | 23 | 12 | 25 | 13 | -8,00% |
| Municipality of Barneveld | 57339 | 75 | 13 | 79 | 14 | -5,06% |
| Municipality of Lochem | 33574 | 44 | 13 | 59 | 18 | -25,42% |
| Municipality of Montferland | 35627 | 46 | 13 | 49 | 14 | -6,12% |
| Municipality of Nijkerk | 42307 | 57 | 13 | 50 | 12 | 14,00% |
| Municipality of Ermelo | 26793 | 38 | 14 | 47 | 18 | -19,15% |
| Municipality of Lower Betuwe | 23615 | 33 | 14 | 28 | 12 | 17,86% |
| Municipality of Scherpenzeel | 9751 | 14 | 14 | 20 | 21 | -30,00% |
| Municipality of West Betuwe | 50349 | 69 | 14 | 69 | 14 | 0,00% |
| Municipality of Apeldoorn | 161156 | 248 | 15 | 317 | 20 | -21,77% |
| Municipality of Zaltbommel | 28014 | 42 | 15 | 41 | 15 | 2,44% |
| Municipality of Epe | 32863 | 53 | 16 | 59 | 18 | -10,17% |
| Municipality of Maasdriel | 24350 | 40 | 16 | 29 | 12 | 37,93% |
| Municipality of Wells | 24313 | 40 | 16 | 44 | 18 | -9,09% |
| Municipality of Westervoort | 15015 | 24 | 16 | 25 | 17 | -4,00% |
| Municipality of Tiel | 41465 | 71 | 17 | 77 | 19 | -7,79% |
| Municipality of Voorst | 24310 | 41 | 17 | 55 | 23 | -25,45% |
| Municipality of Nijmegen | 175948 | 315 | 18 | 417 | 24 | -24,46% |
| Municipality of Renkum | 31338 | 56 | 18 | 68 | 22 | -17,65% |
| Municipality of Rheden | 43527 | 77 | 18 | 114 | 26 | -32,46% |
| Municipality of Arnhem | 157223 | 301 | 19 | 375 | 24 | -19,73% |
| Municipality of Wageningen | 38412 | 74 | 19 | 72 | 19 | 2,78% |
| Municipality of Ede | 114682 | 263 | 23 | 258 | 22 | 1,94% |
| Municipality of Rozendaal | 1575 | 5 | 32 | 3 | 19 | 66,67% |

