Number of Burglaries North Brabant Rises by 18% Where Nationwide Declines by 12%
Based on Crime in Map figures published by Politie.nl, Cheap Locksmith Amsterdam 365 commissioned a survey of all burglaries in 2018 in the province of North Brabant. In this article, we show you the burglary rates of 2018 and the burglary rates compared to 2017. We show which municipality in North Brabant is more likely to experience burglaries compared to other municipalities, and which municipality has seen the greatest decrease in burglary rates. First, it is striking that the average number of burglaries in North Brabant has increased by 18%, while nationally the number of burglaries has decreased by 12%. A gap of about 30%. What stands out in the survey in municipality of North Brabant:- In Hilvarenbeek municipality, the number of burglaries increased by more than 300%.
- In Cranendonk municipality, the number of burglaries more than doubled.
- Overall, there are 17 municipalities in which the number of burglaries increased by more than 20%.
- There has been a decrease of almost 50% in the number of burglaries in Oirschot municipality.
- Municipality of Landschot has proportionally the highest number of burglaries while being one of the smaller municipalities.
- In the largest municipality (Eindhoven) the most burglaries are committed, and per 10,000 inhabitants, Eindhoven ranks #3 with most burglaries.
- In the municipality of Landerd, there are proportionally 3.5 times as many burglaries as in the municipality of Eindhoven.
Number of Burglaries Per Municipality Per 10,000 Inhabitants in North Brabant in 2018
10 Municipalities With the Least Burglaries in North Brabant in 2018
The differences in burglaries among the various North Brabant municipalities are enormous. Even when the communities are adjacent. The municipality with the fewest burglaries is Oirschot with 9.2 burglaries per 10,000 inhabitants. Geertruidenberg and Dongen share second place with 9.3 burglaries per 10,000 inhabitants. Number 3 is Bergen op Zoom: 9.5 burglaries per 10,000 inhabitants. At number 4 is Veldhoven: 9.6 burglaries per 10,000 inhabitants. Coming in last (number 5) is Altena with 9.9 burglaries per 10,000 residents.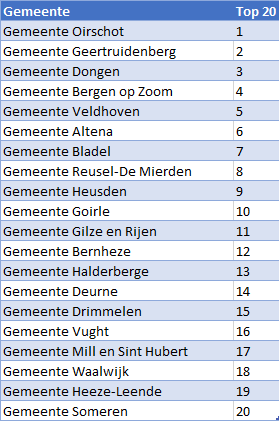
10 Municipalities With the Most Burglaries in North Brabant in 2018
The municipality of Landerd ranks No. 1 among North Brabant municipalities with the most burglaries: 33.9 burglaries per 10,000 inhabitants. Cranendonck follows with 33.4 burglaries per 10,000 residents. Eindhoven ranks 3: 27.6 burglaries per 10,000 residents. Roosendaal is number 4: 26.5 burglaries per 10,000 inhabitants. Finally, Helmond is No. 5 with 26.2 burglaries per 10,000 residents.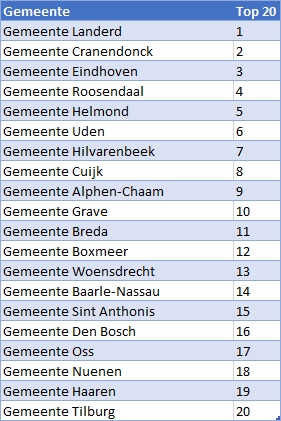
10 Municipalities With the Greatest Increase in Burglaries in North Brabant (2018 vs. 2017)
North Brabant municipalities with largest increase
In terms of the increase in burglaries in 2018, Hilvarenbeek leaves other municipalities far behind. The increase is a whopping 337.5 percent. It should be added that in 2017 there were very few burglaries in Hilvarenbeek. The burglary rate is still below the national average (Hilvarenbeek 22.8 per 10,000 inhabitants, the Netherlands: 24.1 burglaries per 10,000 inhabitants). There is also a large increase in the number of burglaries in Cranendonck: 223.8 percent. Number 3 is Boekel with an increase of 142.9 percent. Number 4 is Landerd: 116.7 percent. Uden is number 5 with an increase of 104.2 percent.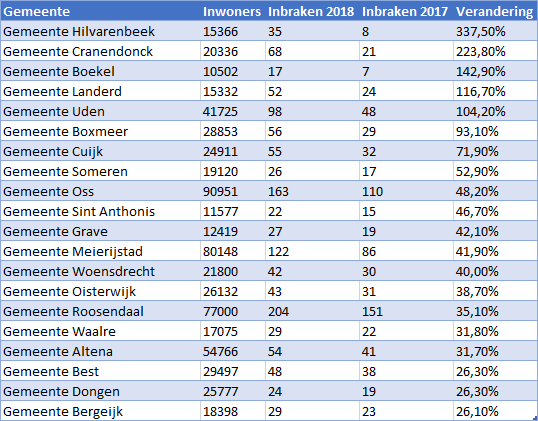
10 Municipalities With the Biggest Decline in Burglaries in North Brabant (2018 vs. 2017)
Although the number of burglaries is rising in North Brabant as a whole, there are also some municipalities where the number of burglaries has declined. In Oirschot, the burglary rate dropped the most: 46.9 percent. In Baarle-Nassau, there was also a big drop: 38.1 percent. Deurne ranks No. 3 among municipalities with the largest decrease in burglaries: 27.8 percent. Eersel ranks No. 4: 26.3 percent. At No. 5 is Bergen op Zoom with 24.1 percent.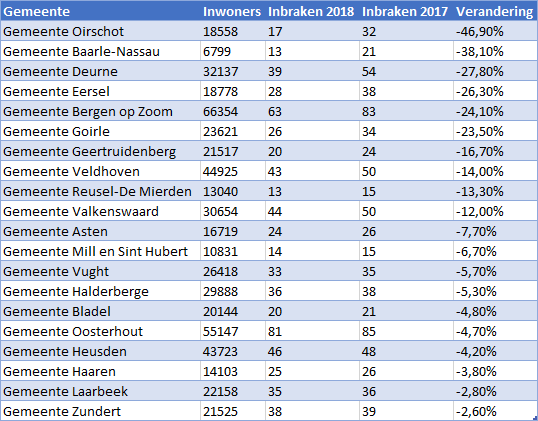
Comparison Number of Burglaries 2018 vs. 2017 By Municipality in North Brabant
All Burglary Investigations 2018
Burglary Research in the Netherlands (2018) Burglary Investigation Province of Groningen (2018) Burglary Investigation Province of Friesland (2018) Burglary Investigation Province of North Holland (2018) Burglary Investigation County of Drenthe (2018) Burglary Investigation Province of Flevoland (2018) Burglary Investigation Province of Overijssel (2018) Burglary Investigation Province of Gelderland (2018) Burglary Investigation Province of South Holland (2018) Burglary Investigation Province of Utrecht (2018) Burglary Investigation Province of Zeeland (2018) Burglary Investigation Province of North Brabant (2018) Burglary Investigation Province of Limburg (2018)Total Overview of Number of Burglaries in Province of North Brabant By Municipality (2018 & 2017)
| Place name | Number of inhabitants | Burglaries 2018 | Per 10,000 population 2018 | Burglaries 2017 | Per 10,000 population 2018 | Change |
| Municipality of Bergen op Zoom | 66354 | 63 | 9 | 83 | 13 | -24,10% |
| Municipality of Dongen | 25777 | 24 | 9 | 19 | 7 | 26,30% |
| Municipality of Geertruidenberg | 21517 | 20 | 9 | 24 | 11 | -16,70% |
| Municipality of Oirschot | 18558 | 17 | 9 | 32 | 17 | -46,90% |
| Municipality of Altena | 54766 | 54 | 10 | 41 | 7 | 31,70% |
| Municipality of Bladel | 20144 | 20 | 10 | 21 | 10 | -4,80% |
| Municipality of Reusel-De Mierden | 13040 | 13 | 10 | 15 | 12 | -13,30% |
| Municipality of Veldhoven | 44925 | 43 | 10 | 50 | 11 | -14,00% |
| Municipality of Gilze and Rijen | 26313 | 30 | 11 | 29 | 11 | 3,40% |
| Municipality of Goirle | 23621 | 26 | 11 | 34 | 14 | -23,50% |
| Municipality of Heusden | 43723 | 46 | 11 | 48 | 11 | -4,20% |
| Municipality of Bernheze | 30550 | 36 | 12 | 34 | 11 | 5,90% |
| Municipality of Deurne | 32137 | 39 | 12 | 54 | 17 | -27,80% |
| Municipality of Drimmelen | 27063 | 33 | 12 | 30 | 11 | 10,00% |
| Municipality of Halderberge | 29888 | 36 | 12 | 38 | 13 | -5,30% |
| Municipality of Vught | 26418 | 33 | 12 | 35 | 13 | -5,70% |
| Municipality of Heeze-Leende | 15886 | 21 | 13 | 17 | 11 | 23,50% |
| Municipality of Mill and Sint Hubert | 10831 | 14 | 13 | 15 | 14 | -6,70% |
| Municipality of Waalwijk | 47725 | 62 | 13 | 57 | 12 | 8,80% |
| Municipality of Asten | 16719 | 24 | 14 | 26 | 16 | -7,70% |
| Municipality of Etten-Leur | 43532 | 60 | 14 | 53 | 12 | 13,20% |
| Municipality of Gemert-Bakel | 30340 | 42 | 14 | 36 | 12 | 16,70% |
| Municipality of Moerdijk | 36967 | 53 | 14 | 51 | 14 | 3,90% |
| Municipality of Sint-Michielsgestel | 28673 | 39 | 14 | 33 | 12 | 18,20% |
| Municipality of Someren | 19120 | 26 | 14 | 17 | 9 | 52,90% |
| Municipality of Valkenswaard | 30654 | 44 | 14 | 50 | 16 | -12,00% |
| Municipality of Eersel | 18778 | 28 | 15 | 38 | 20 | -26,30% |
| Municipality of Loon op Zand | 23120 | 34 | 15 | 27 | 12 | 25,90% |
| Municipality of Meierijstad | 80148 | 122 | 15 | 86 | 11 | 41,90% |
| Municipality of Oosterhout | 55147 | 81 | 15 | 85 | 15 | -4,70% |
| Municipality of Steenbergen | 24781 | 36 | 15 | 36 | 15 | 0,00% |
| Municipality of Bergeijk | 18398 | 29 | 16 | 23 | 13 | 26,10% |
| Municipality of Best | 29497 | 48 | 16 | 38 | 13 | 26,30% |
| Municipality of Boekel | 10502 | 17 | 16 | 7 | 7 | 142,90% |
| Municipality of Boxtel | 30672 | 49 | 16 | 40 | 13 | 22,50% |
| Municipality of Geldrop-Mierlo | 39252 | 61 | 16 | 54 | 14 | 13,00% |
| Municipality of Laarbeek | 22158 | 35 | 16 | 36 | 16 | -2,80% |
| Municipality of Oisterwijk | 26132 | 43 | 16 | 31 | 12 | 38,70% |
| Municipality of Rucphen | 22401 | 36 | 16 | 34 | 15 | 5,90% |
| Municipality of Son and Breugel | 16753 | 26 | 16 | 24 | 14 | 8,30% |
| Municipality of Waalre | 17075 | 29 | 17 | 22 | 13 | 31,80% |
| Municipality of Haaren | 14103 | 25 | 18 | 26 | 18 | -3,80% |
| Municipality of Nuenen | 23019 | 41 | 18 | 34 | 15 | 20,60% |
| Municipality of Oss | 90951 | 163 | 18 | 110 | 12 | 48,20% |
| Municipality of Tilburg | 215521 | 382 | 18 | 392 | 18 | -2,60% |
| Municipality of Zundert | 21525 | 38 | 18 | 39 | 18 | -2,60% |
| Municipality of Baarle-Nassau | 6799 | 13 | 19 | 21 | 31 | -38,10% |
| Municipality of Boxmeer | 28853 | 56 | 19 | 29 | 10 | 93,10% |
| Municipality of Den Bosch | 153434 | 289 | 19 | 244 | 16 | 18,40% |
| Municipality of Sint Anthonis | 11577 | 22 | 19 | 15 | 13 | 46,70% |
| Municipality of Woensdrecht | 21800 | 42 | 19 | 30 | 14 | 40,00% |
| Municipality of Breda | 183448 | 393 | 21 | 370 | 20 | 6,20% |
| Municipality of Alphen-Chaam | 10083 | 22 | 22 | 18 | 18 | 22,20% |
| Municipality of Cuijk | 24911 | 55 | 22 | 32 | 13 | 71,90% |
| Municipality of Grave | 12419 | 27 | 22 | 19 | 15 | 42,10% |
| Municipality of Hilvarenbeek | 15366 | 35 | 23 | 8 | 5 | 337,50% |
| Municipality of Uden | 41725 | 98 | 23 | 48 | 12 | 104,20% |
| Municipality of Helmond | 90903 | 238 | 26 | 242 | 27 | -1,70% |
| Municipality of Roosendaal | 77000 | 204 | 26 | 151 | 20 | 35,10% |
| Municipality of Eindhoven | 229126 | 633 | 28 | 550 | 24 | 15,10% |
| Municipality of Cranendonck | 20336 | 68 | 33 | 21 | 10 | 223,80% |
| Municipality of Landerd | 15332 | 52 | 34 | 24 | 16 | 116,70% |

