Burglaries in Overijssel Decline Less Than National Average
Based on figures from Crime in Map, published by Politie.nl, the reliable Locksmith Amsterdam 365 commissioned a survey of all burglaries in 2018 in the province of Overijssel. In this article, we show you the burglary rates of 2018 and the burglary rates compared to 2017. We show which municipality in Overijssel is more likely to experience burglaries compared to other municipalities and in which municipality the burglary rate has decreased the most. In 2018, the number of burglaries decreased by 4.8 percent. This is only a small decrease compared to the whole of the Netherlands. In fact, nationwide, the number of burglaries fell by 11.6 percent. To compare the number of burglaries in areas with different numbers of residents, we look at the number of burglaries per 10,000 residents. In Overijssel, there were 14.0 burglaries per 10,000 residents in 2018. This is lower than the national average: 17.1 burglaries per 10,000 residents. What stands out even more in the survey in Overijssel Province:- The smallest municipality (Staphorst) has proportionally the least number of burglaries.
- The second smallest municipality (Ommen) has proportionally the most number of burglaries.
- Municipality of Enschede has the most number of burglaries and proportionally the second-most burglaries.
- In municipality of Zwartewaterland, the number of burglaries increased 214% compared to 2017.
- In municipality Hardenberg is number 3 with the number of burglaries per 10,000 inhabitants and is number 2 with the largest increase in the number of burglaries with a 74% increase.
- In municipality of Olst-Wijhe, number of burglaries dropped by as much as 60%
10 Municipalities With the Most Burglaries in Overijssel in 2018
The municipality with the least number of burglaries per 10,000 inhabitants in Overijssel is Staphorst with 4.2 burglaries. Olst-Wijhe is No. 2 with 4.4. Number 3 is Dinkelland: 4.9 burglaries. Borne is number 4: 5.6 residents. Last is the municipality of Dalfsen with 6.7 burglaries per 10,000 residents. To summarize: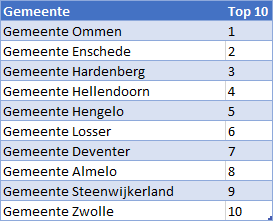
10 Municipalities With the Least Burglaries in Overijssel in 2018
Usually the rule is: the larger the city, the higher the number of burglaries per 10,000 residents. The municipality of Ommen is a great exception. This municipality has only 17630 inhabitants, but it is the Overijssel municipality with largest number of burglaries: 23.8 burglaries per 10,000 inhabitants. Number 2 is Enschede with 22.6 burglaries. Hardenberg is No. 3: 21.3. Number 4 is Hellendoorn with 20.4 burglaries. Last comes Hengelo: 15.8 burglaries per 10,000 inhabitants.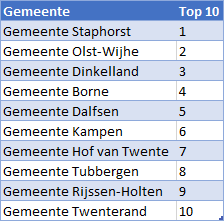
10 Municipalities With the Greatest Increase in Burglaries in Overijssel (2018 vs. 2017)
Not all municipalities in Overijssel saw a decrease in burglaries. In some municipalities, the number of burglaries actually increased. Topping the list is Zwartewaterland with a huge increase of 212.5 percent. At No. 2 is Hardenberg with an increase of 74.3 percent. Kampen is number 3: its burglary rate is up 66.7 percent. Number 4 is Ommen with a 61.5 percent increase. Last comes Hellendoorn with an increase of 58.7 percent. Summary: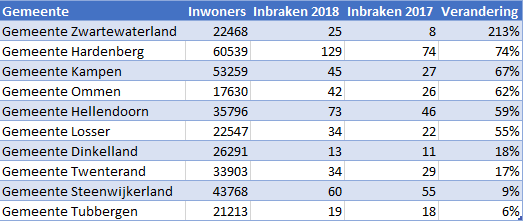
10 Municipalities With the Biggest Decline in Burglaries in Overijssel (2018 vs. 2017)
The municipality with the largest decrease in burglaries in Overijssel is Olst-Wijhe with a whopping 60 percent. Borne next has the largest decrease at 50 percent. At No. 3 is Staphorst: down 41.7 percent. Hengelo comes next: the number of burglaries dropped 37.7 percent. At No. 5 is Almelo with the drop of 31.8 percent. To summarize: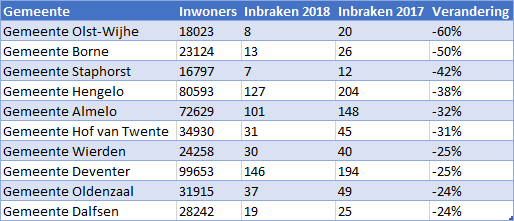
Number of Burglaries Per Municipality Per 10,000 Inhabitants in Overijssel in 2018
Comparison Number of Burglaries 2018 vs. 2017 By Municipality in Overijssel
All Burglary Investigations 2018
Burglary Research in the Netherlands (2018) Burglary Investigation Province of Groningen (2018) Burglary Investigation Province of Friesland (2018) Burglary Investigation Province of North Holland (2018) Burglary Investigation County of Drenthe (2018) Burglary Investigation Province of Flevoland (2018) Burglary Investigation Province of Overijssel (2018) Burglary Investigation Province of Gelderland (2018) Burglary Investigation Province of South Holland (2018) Burglary Investigation Province of Utrecht (2018) Burglary Investigation Province of Zeeland (2018) Burglary Investigation Province of North Brabant (2018) Burglary Investigation Province of Limburg (2018)Total Overview Number of Burglaries in Overijssel Province By Municipality (2018 & 2017)
| Place name | Number of inhabitants | Burglaries 2018 | Per 10,000 population 2018 | Burglaries 2017 | Per 10,000 population 2017 | Change |
| Gem. Olst-Wijhe | 18023 | 8 | 4 | 20 | 11 | -60,00% |
| Gem. Staphorst | 16797 | 7 | 4 | 12 | 7 | -41,70% |
| Gem. Dinkelland | 26291 | 13 | 5 | 11 | 4 | 18,20% |
| Gem. Borne | 23124 | 13 | 6 | 26 | 11 | -50,00% |
| Gem. Dalfsen | 28242 | 19 | 7 | 25 | 9 | -24,00% |
| Gem. Kampen | 53259 | 45 | 8 | 27 | 5 | 66,70% |
| Gem. Court of Twente | 34930 | 31 | 9 | 45 | 13 | -31,10% |
| Gem. Tubbergen | 21213 | 19 | 9 | 18 | 8 | 5,60% |
| Gem. Haaksbergen | 24291 | 25 | 10 | 25 | 10 | 0,00% |
| Gem. Rijssen-Holten | 38097 | 37 | 10 | 38 | 10 | -2,60% |
| Gem. Twenterand | 33903 | 34 | 10 | 29 | 9 | 17,20% |
| Gem. Blackwaterland | 22468 | 25 | 11 | 8 | 4 | 212,50% |
| Gem. Oldenzaal | 31915 | 37 | 12 | 49 | 15 | -24,50% |
| Gem. Raalte | 37158 | 45 | 12 | 45 | 12 | 0,00% |
| Gem. Wierden | 24258 | 30 | 12 | 40 | 16 | -25,00% |
| Gem. Zwolle | 126116 | 159 | 13 | 159 | 13 | 0,00% |
| Gem. Almelo | 72629 | 101 | 14 | 148 | 20 | -31,80% |
| Gem. Steenwijkerland | 43768 | 60 | 14 | 55 | 13 | 9,10% |
| Gem. Deventer | 99653 | 146 | 15 | 194 | 19 | -24,70% |
| Gem. Losser | 22547 | 34 | 15 | 22 | 10 | 54,50% |
| Gem. Hengelo | 80593 | 127 | 16 | 204 | 25 | -37,70% |
| Gem. Hellendoorn | 35796 | 73 | 20 | 46 | 13 | 58,70% |
| Gem. Hardenberg | 60539 | 129 | 21 | 74 | 12 | 74,30% |
| Gem. Enschede | 158261 | 357 | 23 | 351 | 22 | 1,70% |
| Gem. Ommen | 17630 | 42 | 24 | 26 | 15 | 61,50% |

