Most Burglaries and Biggest Increase in Burglaries in Municipality of Stein in 2018
Smaller municipalities have fewer burglaries per capita on average
Based on Crime in Map figures published by Politie.nl, the reliable Locksmith Amsterdam 365 commissioned a study of all burglaries in 2018 in the province of Limburg.
In this article, we show you the burglary rates of 2018 and the burglary rates compared to 2017. We show which municipality in Limburg is more likely to experience burglaries compared to other municipalities and in which municipality the burglary rate has declined the most.
What stands out in the research in municipality of Limburg:
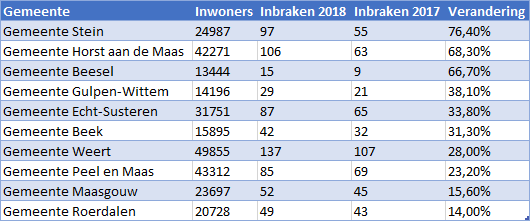
- Municipality of Stein has proportionally the most burglaries and largest increase in the number of burglaries compared to 2017 with an increase of 76.40%.
- Municipality of Bergen (LB) has fewest burglaries and a sharp decrease in the number of burglaries compared to 2017.
- Smaller municipalities tend to have proportionally fewer burglaries.
- In municipality Stein, Horst aan de Maas and Beesel, the number of burglaries increases 2x faster (or more) than all other municipalities.
- In Municipality of Mook and Miller and Vaals, the number of burglaries decreased by more than 60%.
Number of Burglaries Per Municipality Per 10,000 Inhabitants in Limburg in 2018
Enter your municipality in the search bar and instantly see the number of burglaries per 10,000 inhabitants in Limburg.
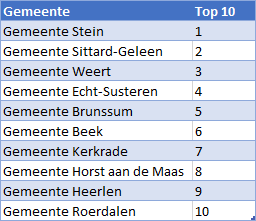
10 Municipalities With the Most Burglaries in Limburg in 2018
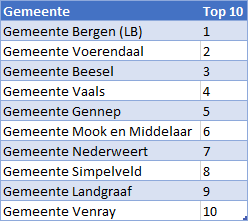
10 Municipalities With the Least Burglaries in Limburg in 2018
10 Municipalities With the Greatest Increase in Burglaries in Limburg (2018 vs. 2017)
10 Municipalities With the Biggest Decline in Burglaries in Limburg (2018 vs. 2017)
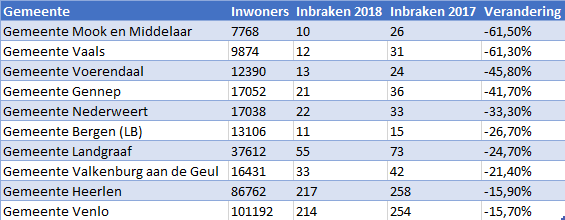
Comparison Number of Burglaries 2018 vs. 2017 Per Municipality in Limburg
All Burglary Investigations 2018
Burglary Research in the Netherlands (2018)
Burglary Investigation Province of Groningen (2018)
Burglary Investigation Province of Friesland (2018)
Burglary Investigation Province of North Holland (2018)
Burglary Investigation County of Drenthe (2018)
Burglary Investigation Province of Flevoland (2018)
Burglary Investigation Province of Overijssel (2018)
Burglary Investigation Province of Gelderland (2018)
Burglary Investigation Province of South Holland (2018)
Burglary Investigation Province of Utrecht (2018)
Burglary Investigation Province of Zeeland (2018)
Burglary Investigation Province of North Brabant (2018)
Burglary Investigation Province of Limburg (2018)
Total Overview of Number of Burglaries in Province of Limburg By Municipality (2018 & 2017)
| Place name | Number of inhabitants | Burglaries 2018 | Per 10,000 population 2018 | Burglaries 2017 | Per 10,000 population 2017 | Change |
| Municipality of Bergen (LB) | 13106 | 11 | 8 | 15 | 11 | -26,70% |
| Municipality of Voerendaal | 12390 | 13 | 10 | 24 | 19 | -45,80% |
| Municipality of Beesel | 13444 | 15 | 11 | 9 | 7 | 66,70% |
| Municipality of Gennep | 17052 | 21 | 12 | 36 | 21 | -41,70% |
| Municipality of Vaals | 9874 | 12 | 12 | 31 | 31 | -61,30% |
| Municipality of Mook and Middelaar | 7768 | 10 | 13 | 26 | 33 | -61,50% |
| Municipality of Nederweert | 17038 | 22 | 13 | 33 | 19 | -33,30% |
| Municipality of Simpelveld | 10561 | 15 | 14 | 17 | 16 | -11,80% |
| Municipality of Landgraaf | 37612 | 55 | 15 | 73 | 19 | -24,70% |
| Municipality of Venray | 43341 | 68 | 16 | 73 | 17 | -6,80% |
| Municipality of Meerssen | 19039 | 34 | 18 | 40 | 21 | -15,00% |
| Municipality of Beekdaelen | 35969 | 73 | 20 | 86 | 24 | -15,10% |
| Municipality of Eijsden-Margraten | 25566 | 50 | 20 | 59 | 23 | -15,30% |
| Municipality of Gulpen-Wittem | 14196 | 29 | 20 | 21 | 15 | 38,10% |
| Municipality of Leudal | 35857 | 71 | 20 | 71 | 20 | 0,00% |
| Municipality of Peel and Maas | 43312 | 85 | 20 | 69 | 16 | 23,20% |
| Municipality of Valkenburg aan de Geul | 16431 | 33 | 20 | 42 | 26 | -21,40% |
| Municipality of Venlo | 101192 | 214 | 21 | 254 | 25 | -15,70% |
| Municipality of Maasgouw | 23697 | 52 | 22 | 45 | 19 | 15,60% |
| Municipality of Maastricht | 122723 | 269 | 22 | 309 | 25 | -12,90% |
| Municipality of Roermond | 57761 | 125 | 22 | 135 | 23 | -7,40% |
| Municipality of Roerdalen | 20728 | 49 | 24 | 43 | 21 | 14,00% |
| Municipality of Heerlen | 86762 | 217 | 25 | 258 | 30 | -15,90% |
| Municipality of Horst aan de Maas | 42271 | 106 | 25 | 63 | 15 | 68,30% |
| Municipality of Beek | 15895 | 42 | 26 | 32 | 20 | 31,30% |
| Municipality of Kerkrade | 45823 | 119 | 26 | 130 | 28 | -8,50% |
| Municipality of Brunssum | 28241 | 77 | 27 | 75 | 27 | 2,70% |
| Municipality of Echt-Susteren | 31751 | 87 | 27 | 65 | 20 | 33,80% |
| Municipality of Weert | 49855 | 137 | 27 | 107 | 21 | 28,00% |
| Municipality of Sittard-Geleen | 92956 | 339 | 36 | 382 | 41 | -11,30% |
| Municipality of Stein | 24987 | 97 | 39 | 55 | 22 | 76,40% |

