Number of Burglaries Increased by 40% in Groningen
Based on Crime in Map figures published by Politie.nl, Locksmith Amsterdam 365 commissioned a survey of all 2018 burglaries in the province of Groningen.
In this article, we show you the burglary rates of 2018 and the burglary rates compared to 2017. We show which municipality in Groningen is more likely to experience burglaries compared to other municipalities and in which municipality the burglary rate has decreased the most.
For the first time in a long time, the number of burglaries in Groningen has increased again. Rising lines, higher percentages and growing numbers.
What stands out in the survey in Groningen municipality:
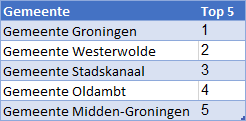
- The municipality of Groningen has the highest number of burglaries in absolute and relative terms. In addition, the number of burglaries increased 40% in 2018 compared to 2017.
- Municipality of Westerwolde has the second-most number of burglaries and sees the largest increase in burglaries +78%.
- Municipality of Appingedam sees number of burglaries decrease by 35% compared to 2017.
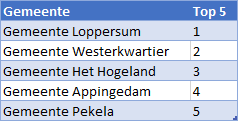
- Smallest municipality (Loppersum) also has proportionally the least number of burglaries.
- Municipality Westerkwartier has proportionally three fewer burglaries than municipality Groningen.
Number of Burglaries Per Municipality Per 10,000 Inhabitants in Groningen in 2018
5 Municipalities With the Most Burglaries in Groningen in 2018

5 Municipalities With the Least Burglaries in Groningen in 2018

5 Municipalities With the Biggest Increase in Burglaries in Groningen (2018 vs. 2017)
The year 2018 was one that burglars will say was a fine year. Let’s look at the most drastic increases:

5 Municipalities With the Biggest Decline in Burglaries in Groningen (2018 vs. 2017)
Of course, there are also municipalities where there were fewer burglaries this year. Here are the top five municipalities that improved the most:

Comparison Number of Burglaries 2018 vs. 2017 By Municipality in Groningen
All Burglary Investigations 2018
Burglary Research in the Netherlands (2018)
Burglary Investigation Province of Groningen (2018)
Burglary Investigation Province of Friesland (2018)
Burglary Investigation Province of North Holland (2018)
Burglary Investigation County of Drenthe (2018)
Burglary Investigation Province of Flevoland (2018)
Burglary Investigation Province of Overijssel (2018)
Burglary Investigation Province of Gelderland (2018)
Burglary Investigation Province of South Holland (2018)
Burglary Investigation Province of Utrecht (2018)
Burglary Investigation Province of Zeeland (2018)
Burglary Investigation Province of North Brabant (2018)
Burglary Investigation Province of Limburg (2018)
Total Summary Number of Burglaries in Groningen County By Municipality (2018 & 2017)
| Place name | Number of inhabitants | Burglaries 2018 | Per 10000 inhabitants 2018 | Burglaries 2017 | Per 10000 population 2017 | Change |
| Municipality of Loppersum | 9732 | 8 | 8 | 6 | 6 | 33,30% |
| Municipality of Westerkwartier | 62844 | 56 | 9 | 56 | 9 | 0,00% |
| Municipality of The Hogeland | 48019 | 47 | 10 | 48 | 10 | -2,10% |
| Municipality of Appingedam | 11801 | 13 | 11 | 20 | 17 | -35,00% |
| Municipality of Pekela | 12245 | 14 | 11 | 14 | 11 | 0,00% |
| Municipality of Delfzijl | 24863 | 30 | 12 | 43 | 17 | -30,20% |
| Municipality of Veendam | 27508 | 37 | 13 | 38 | 14 | -2,60% |
| Municipality of Central Groningen | 60953 | 82 | 13 | 69 | 11 | 18,80% |
| Municipality of Oldambt | 38075 | 55 | 14 | 59 | 15 | -6,80% |
| Municipality of Stadskanaal | 32258 | 74 | 23 | 44 | 14 | 68,20% |
| Municipality of Westerwolde | 24684 | 57 | 23 | 32 | 13 | 78,10% |
| Municipality of Groningen | 229962 | 589 | 26 | 414 | 18 | 42,30% |


