Burglaries in Friesland Below National Average of 2018
Leeuwarden considerably above average
Based on Crime in Map figures published by Politie.nl, Locksmith Amsterdam 365 commissioned a survey of all burglaries in 2018 in the province of Friesland.
In this article, we show you the burglary rates of 2018 and the burglary rates compared to 2017. We show which municipality in Friesland is more likely to experience burglaries compared to other municipalities and in which municipality the burglary rate has decreased the most.
On average, there are 17.1 burglaries per 10,000 residents in the Netherlands. In Friesland, there is an average of 15.5 burglaries per 10,000 inhabitants, which is thus well below the national average.
In the Netherlands, the number of burglaries decreased by 11.6 percent in 2018. Unfortunately for those living in Friesland, the number of burglaries there is up a whopping 15.7 percent. The municipality of Leeuwarden plays and major role in this.
What stands out in the survey in municipality of Friesland:
- In the municipality of Achtkarspelen, the number of burglaries increased by 140%.
- In the municipality of Ter Schelling, the number of burglaries decreased by 85%.
- The municipality of Leeuwarden has at least 50% more burglaries per 10,000 inhabitants than any other municipality in Friesland.
- The largest and smallest municipalities rank 1 and 2 of municipalities with the most burglaries.
- Ter Schelling is by far the safest island.
Number of Burglaries Per Municipality Per 10,000 Inhabitants in Friesland in 2018
Frisian Municipalities with the Least Number of Burglaries
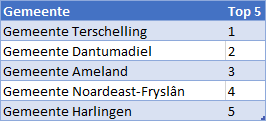
The safest Frisian municipality in terms of burglary is Terschelling with only 2.0 burglaries per 10,000 inhabitants. The municipality of Dantumadeel ranks number 2 with 4.2 burglaries per 10,000 inhabitants. At number 3 is Ameland with 5.5 burglaries per 10,000 residents. All of these municipalities are thus well below the average number of burglaries per 10,000 in the Netherlands.
5 Municipalities With the Least Burglaries in Friesland in 2018

Frisian Municipalities with the Most Number of Burglaries in 2018
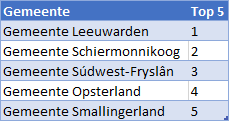
Leeuwarden – Number 1
Leeuwarden has the most burglaries with 31.0 burglaries per 10,000 residents. Well above the national average of 17.4. Especially around Christmas, burglars were busy in Leeuwarden. In the last 3 months of 2018, burglars struck more than 140 times.
Schiermonnikoog and Súdwest-Frylân
The rest of the municipalities in Friesland are below average in terms of burglaries. At number 2 of the Frisian municipalities with the number of burglaries is Schiermonnikoog. There are 21.5 burglaries for every 10,000 residents. Number 3 is the municipality of Súdwest-Fryslân with 15.7 burglaries per 10,000 inhabitants.

5 Municipalities With the Largest Increase in Burglaries in Friesland (2018 vs. 2017)

5 Municipalities With the Biggest Decline in Burglaries in Friesland (2018 vs. 2017)

Comparison Number of Burglaries 2018 vs. 2017 By Municipality in Friesland
All Burglary Investigations 2018
Burglary Research in the Netherlands (2018)
Burglary Investigation Province of Groningen (2018)
Burglary Investigation Province of Friesland (2018)
Burglary Investigation Province of North Holland (2018)
Burglary Investigation County of Drenthe (2018)
Burglary Investigation Province of Flevoland (2018)
Burglary Investigation Province of Overijssel (2018)
Burglary Investigation Province of Gelderland (2018)
Burglary Investigation Province of South Holland (2018)
Burglary Investigation Province of Utrecht (2018)
Burglary Investigation Province of Zeeland (2018)
Burglary Investigation Province of North Brabant (2018)
Burglary Investigation Province of Limburg (2018)
| Place name | Number of inhabitants | Burglaries 2018 | Per 10000 inhabitants 2018 | Burglaries 2017 | Per 10000 population 2017 | Change |
| Municipality of Terschelling | 4906 | 1 | 2 | 7 | 14 | -85,70% |
| Municipality of Dantumadiel | 18904 | 8 | 4 | 10 | 5 | -20,00% |
| Municipality of Ameland | 3654 | 2 | 5 | 0 | 0 | |
| Municipality of Noardeast-Fryslân | 45287 | 33 | 7 | 29 | 6 | 13,80% |
| Municipality of Harlingen | 15783 | 12 | 8 | 14 | 9 | -14,30% |
| Municipality of Achtkarspelen | 27935 | 24 | 9 | 10 | 4 | 140,00% |
| Municipality of Vlieland | 1132 | 1 | 9 | 0 | 0 | |
| Municipality of Waadhoeke | 46101 | 47 | 10 | 33 | 7 | 42,40% |
| Municipality of De Fryske Marren | 51742 | 53 | 10 | 55 | 11 | -3,60% |
| Municipality of Heerenveen | 50192 | 57 | 11 | 55 | 11 | 3,60% |
| Municipality of Ooststellingwerf | 25459 | 29 | 11 | 37 | 15 | -21,60% |
| Municipality of Weststellingwerf | 25720 | 35 | 14 | 29 | 11 | 20,70% |
| Municipality of Tytsjerksteradiel | 31870 | 46 | 14 | 31 | 10 | 48,40% |
| Municipality of Smallingerland | 55889 | 86 | 15 | 97 | 17 | -11,30% |
| Municipality of Opsterland | 29753 | 46 | 15 | 36 | 12 | 27,80% |
| Municipality of Súdwest-Fryslân | 89594 | 141 | 16 | 87 | 10 | 62,10% |
| Municipality of Schiermonnikoog | 932 | 2 | 21 | 0 | 0 | |
| Municipality of Leeuwarden | 122415 | 380 | 31 | 337 | 28 | 12,80% |


